Step-debugging Docker Compose NestJS services
I’m working on a NestJS project that uses monorepo mode. It consists of a number of separate microservice applications that each have their own Docker container that are managed in development using Docker Compose.
I like step-debugging in my IDE and so needed to set it up for this application. This is what I did.
The application setup
Each service in our project has its own container in docker-compose.yaml and we use a reverse proxy to have a single endpoint that routes requests to the correct microservice. Each custom Dockerfile runs ppm run start:dev:{service name}> which is defined in package.json like this:
"start:dev:service1": "nest start service1 --watch --tsc --watchOptions.poll=1000 --preserveWatchOutput",
Using --watchOptions.poll=1000 is just more reliable when running in Docker with volumes mounted into the container. We also set the --preserveWatchOutput flag to ensure that the service doesn’t take control of the terminal as this is unhelpful when you have multiple services in play.
Set the apps up for debugging
We need to make some modification for step debugging. Firstly, I created a set of start:debug:{service name} scripts in package.json that look like this:
"start:debug:service1": "nest start service1 --debug 0.0.0.0:9229 --watch --tsc --watchOptions.poll=1000 --preserveWatchOutput",
We enabled the --debug flag to enable node’s --inspect flag so that port 9229 is available to the debugger. However, buy default this is bound to 127.0.0.1 which is not useful in a container, so we bind to 0.0.0.0:9229 so that it’s available outside the container.
Next, we need to our new start:debug:{service name} scripts and expose port 92229 to our local environment for each service. We do this in docker-compose.override.yaml:
services:
  service1:
    ports:
      - "9230:9229"
    command: pnpm run start:debug:service1

  service2:
    ports:
      - "9231:9229"
    command: pnpm run start:debug:service2
I don’t tend to like binding to the default port as that invariably confuses me when I run some test thing locally, so I’ve picked ports starting from 9230 onwards for my services.
Running docker compose up will now start the containers.
Debugging in WebStorm
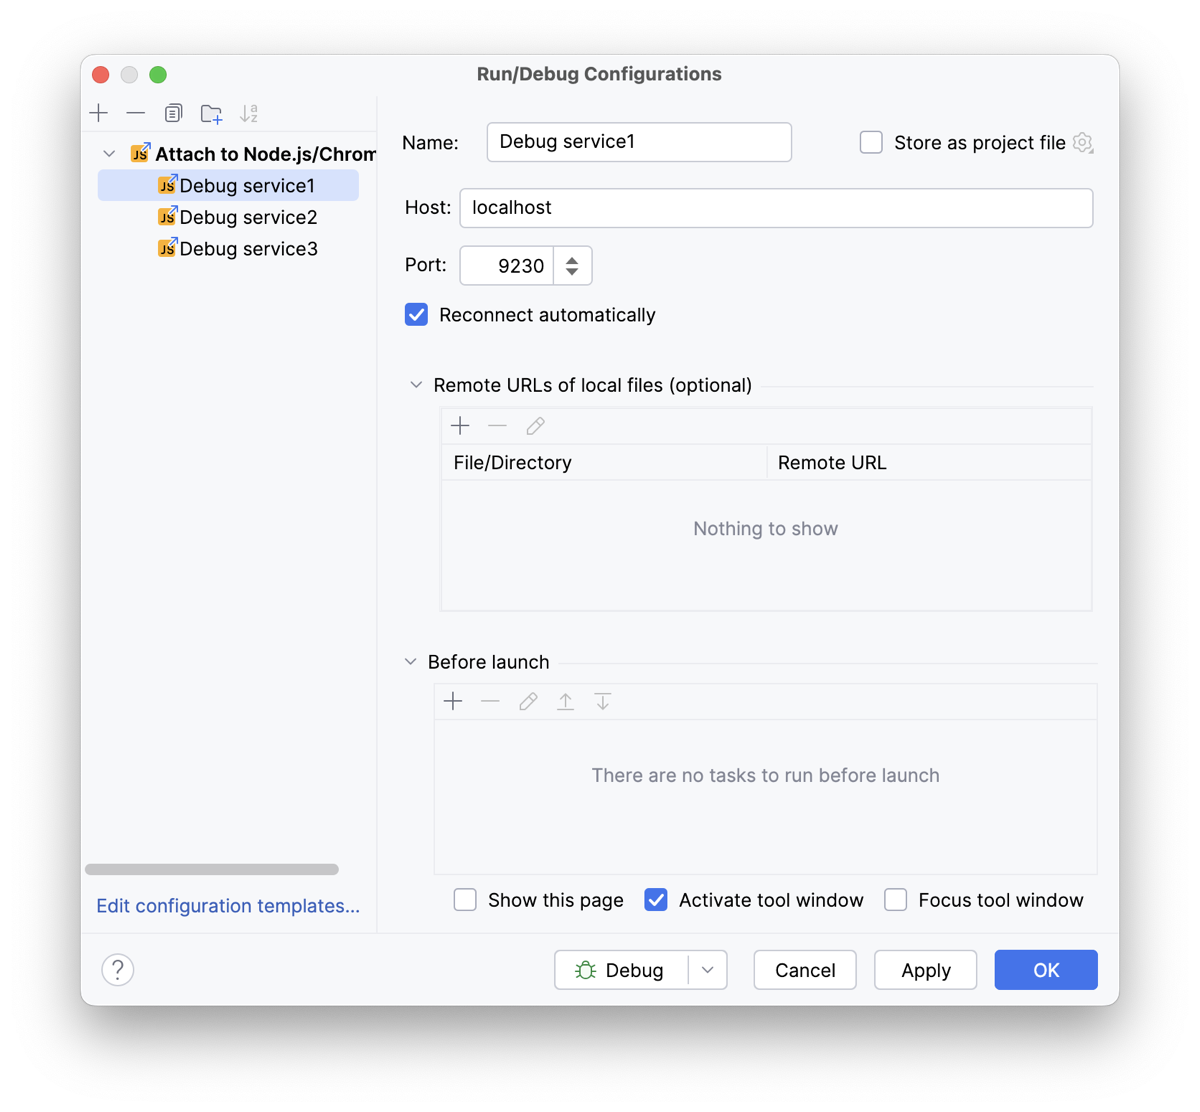
To set up WebStorm for step debugging, create a Run/Debug configuration entry of type Attach to Node.js/Chrome for each container.
The settings for service1 are:
- Name: Debug service1
- Host: localhost
- Port: 9230
For the other services, change the name and port.

From the Debugging dropdown at in the title bar select the service and press the green “bug” button. You’ll see a “Debugger attached.” message in the Docker logs.
Attach a breakpoint and access the endpoint using curl or another HTTP client and the IDE should stop execution at the breakpoint.
Debugging in VS Code
To set up VS Code for step debugging, create a .vscode/launch.json file in your project. It should look like this:
{
  "version": "0.2.0",
  "configurations": [
    {
      "name": "Debug service1",
      "type": "node",
      "request": "attach",
      "port": 9230,
      "address": "localhost",
      "localRoot": "${workspaceFolder}",
      "remoteRoot": "/usr/src/app",
      "restart": true
    },
    {
      "name": "Debug service2",
      "type": "node",
      "request": "attach",
      "port": 9231,
      "address": "localhost",
      "localRoot": "${workspaceFolder}",
      "remoteRoot": "/usr/src/app",
      "restart": true
    }
  ]
}
Set remoteRoot to the directory within the Docker container where the project is mounted.
Start debugging by selecting the Run and Debug pane in the left hand toolbar and choose the service from the dropdown at the top. Then press the green Start debugging button (or press F5).You’ll see a “Debugger attached.” message in the Docker logs.
Attach a breakpoint and access the endpoint using curl or another HTTP client and the IDE should stop execution at the breakpoint.
That’s it
Having done this, I can now enjoy step debugging this new-to-me codebase and understand what it does!


