Getting started with Natural Load Testing
I’ve been following the products of WonderNetwork for a while as they do some interesting stuff with servers around the world. I particularly like Wonder VPN as a drop dead simple and reliable VPN is very handy for any mobile user who wants some security when using a wireless network in Starbucks!
Recently they have been working on a new product called Natural Load Testing which is intended to make load testing your web application very simple. It’s a very friendly service which is immediately apparent on the home page where it says “not logged in, no greeting. how sad”. It’s a little touch that appeals to me.
Natural Load Testing is currently in private beta and the WonderNetwork guys invited me into the beta and have been generous enough to spend a small part of their marketing budget to enable me to be able to publish this article. They’ve even managed to cope with my list of complaints and still talk to me! In this tutorial I will walk through how to use the Natural Load Testing product (as is today) to get some results. Interpreting the results and improving your website and server infrastructure is your job though :)
Getting Started
Natural Load Testing (shortened to NLT in this article!) consists of 4 main areas where you interact with it:
- Creating tests
- Configuring test suites
- Running test suites
- Reviewing results
Upon log in, the home page consists of a set of friendly buttons:
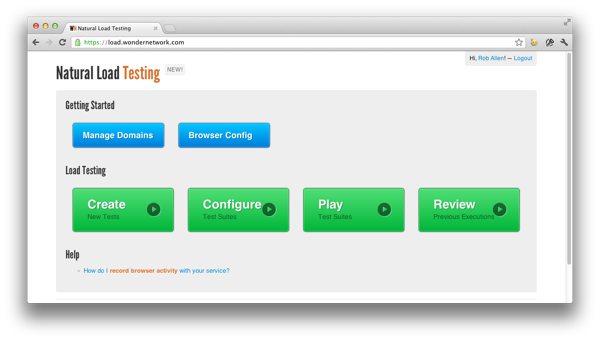
We start at the beginning: creating tests.
Creating tests
When load testing you need to configure your testing tool with the URLs of the pages and resources the you want to be tested. Natural Load Testing makes this job trivial by cleverly leveraging their proxy technology. By configuring your browser to use the NLT proxy, it will record every page you visit and provide you with a list of URLs which you can then use to create tests.
Obviously, as load testing involves hitting the server with a lot of requests, by the time NLT is out of beta, you will need to authorise each domain that you want to use. This is done in the “Manage Authorised Domains” section.
There is a helpful page on the NLT site that explains how to do this. Don’t forget to turn off the proxy after recording. The WonderNetwork people have also remembered that you may want to record HTTPS traffic for load testing, and have provided a root certificate that you’ll need to install. Again, there’s help available on how to install this.
Once you have recorded some URLs, you can then click on the “Create” button and you are presented with a list of the most recent URLs you have recorded.
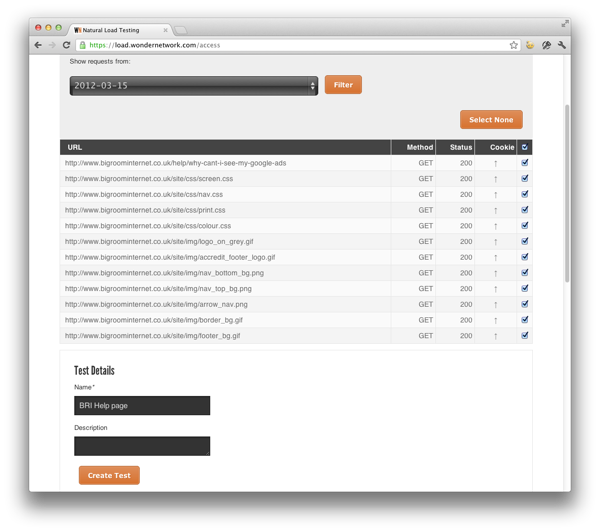
To create the test, you select the URLs that you require to be included (the checkbox in the header selects all within the group, which is very handy!). You then choose a name that will help you remember what this test does and create the test.
In order to create some interesting load tests on our site, I created a good few tests which I could then group into test suites.
Configuring test suites
Your tests are grouped into suites that are then run either sequentially or as a set of random loads. To create a suite, you click on the “Configure” button which then shows you the list of the suites that you have already created.
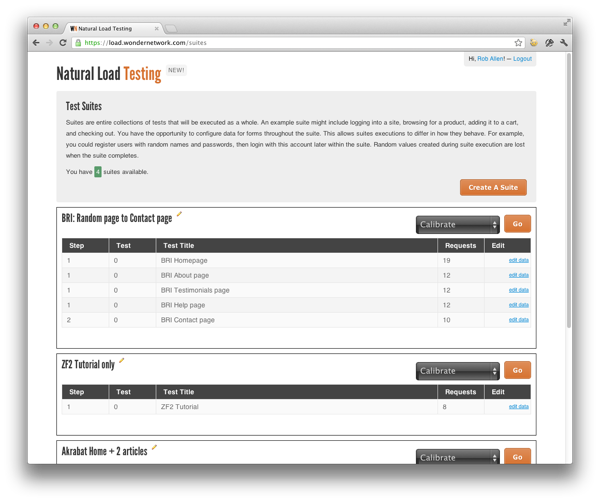
In this screenshot you can see two test suites that I’ve created. The second test “ZF2 Tutorial only” is the simplest suite possible as it contains a single page load within a single step. The top suite shows a more complex suite which hints at the complexity of the suites that you can create.
A suite is composed of one or more steps which are run in sequence. Each step can have multiple tests. If there are multiple test in the same step, then NLT will randomly pick one test for each run.
In this suite I have four tests in step 1 which are a set of pages within the BRI website. Step 2 is the contact page and so this test suite is measuring visiting one of 4 pages within the site and then choosing to go to the contact page.
Creation of a new test suite is done via drag and drop:
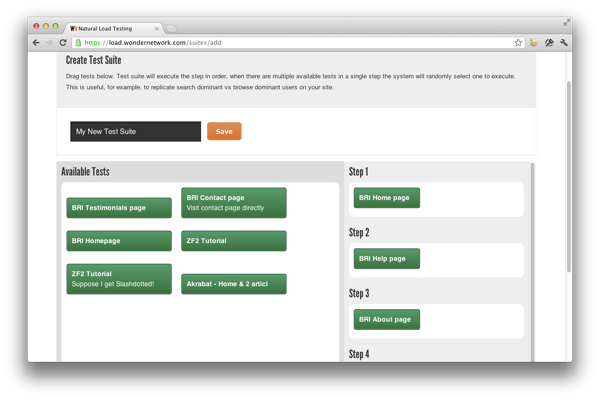
You simply drag your green tests over to the list of steps on the right hand side. It’s all quite easy. Rather weirdly, you can’t reuse the same test in multiple steps, so if you’re testing a cycle, then you need to duplicate the same test so that you can place it into two different steps. I haven’t found a way to edit the steps within a test suite once created either, so make sure you get it right!
Once you have added tests to steps, you can then tell NLT to send data whilst load testing. This is useful for filling in forms or logging into the website, for instance. I haven’t used this section as I haven’t yet tested any pages with forms or requiring login.
Rather useful fully, you can change the domain that a test suite uses. This enables you to duplicate a test suite and then change the domain to test domain that’s running on another server or using a different configuration which makes side-by-side testing a little easier.
Calibration
Once we have created a test suite, the next step is to calibrate it. NLT will not allow you to run a test suite before calibration, so don’t forget this bit! Calibration is done from the test suites list page where there is a drop down box of operations you can do on each suite:
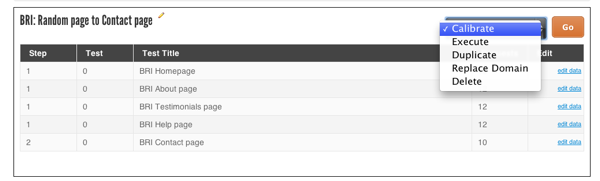
Simply pick Calibrate and press Go. NLT will then perform a single run over your suite and present the standard results page. Ideally, I would like to see this page look different from the standard results page as it’s a calibration run, not a standard test and so I was slightly confused at this point. Also, whilst the test is running, you simply see one of those “spinning gifs” to let you know that something is happening. I ran into a bug in this section which resulted in the calibration run failing, but I was never notified on the page that an error had occurred.
The calibration results on my ZF2 tutorial page suite look like this:
The intent of calibration is to provide a base-line to the NLT of the performance of the suite when there is no load. i.e. the idea is that this single run has provided an indication of the optimal conditions and we are expecting to be within 15% of this performance when testing under load.
Running test suites
Now that we have calibrated test suites, we can run some load tests and see what happens. In NLT parlance, we run test suites by pressing the Play button at which point the terminology changes to from play to execute. Simply select your test suite and press the Execute button. You are then presented with a form in order to set the run parameters:
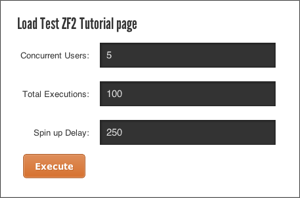
There are three parameters you need to set:
| Concurrent Users | How many users will hit your test suite. For steps with multiple tests, each user will randomly pick one to run. |
|---|---|
| Total Executions | How many times the suite will be run |
| Spin up Delay | Number of milliseconds before introducing the next user. A delay of 500 will results in 2 users per second being introduced to the load up to the total Concurrent users. |
We set these numbers up to create the required load testing profile. I’ve been using 100 users at 250ms spin-up for 2000 total executions as this takes around 30 to 60 seconds to complete a run and seems a reasonable profile for my blog given its traffic levels.
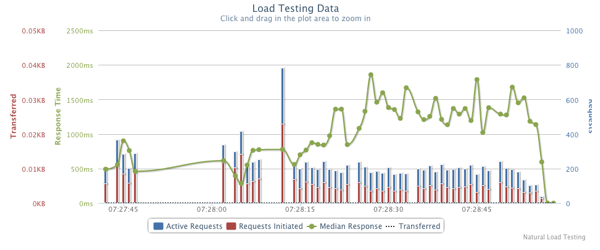
Upon pressing execute, NLT will spin up a number of worker processes on its servers and then display a graph that updates every few seconds showing you what happening:
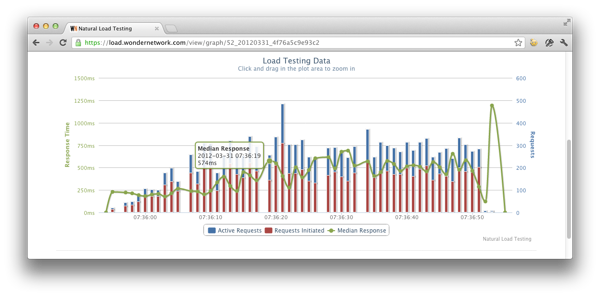
As you can see in the screenshot above, you get this information:
- A bar showing number of active requests (blue) on top of number of requests initiated.
- A line chart of median response time.
The x-axis is in seconds. Hence the red bar chart shows the number of requests initiated during each second and the blue bar shows the number of requests that were still active at the end of the second. Hence a request that completed within a second is counted in the red bar, but not in the blue. Ideally, therefore we would like to see smaller blue bars than red bars and we definitely don’t want to see blue bars getting bigger.
The green line shows us the average time it takes to server all requests in that second. Ideally, we want this number to be lower. Clearly, if there are any errors serving a request (e.g. an nginx bad gateway error), the rather fast failure time is not counted as it would bring the average down!
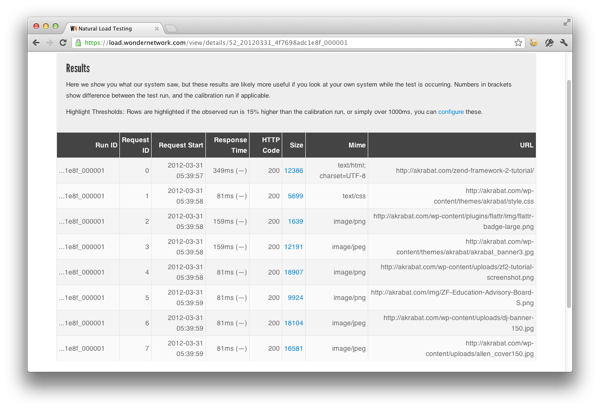
We can also view the data as a table:
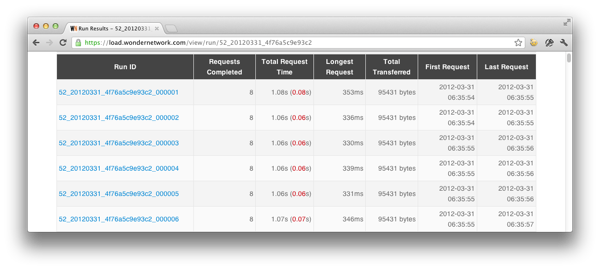
Obviously, this is right at the start of the run, and so all look good. Clicking on a given run id will provide us with more information. This is a run that’s later in the test:
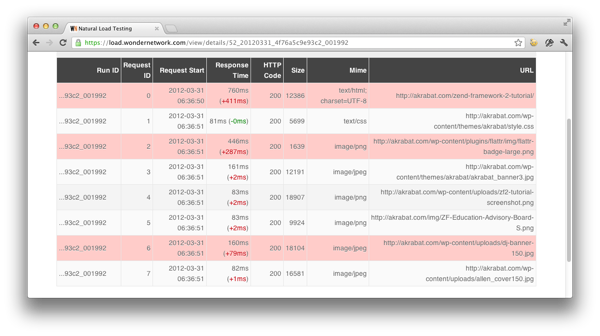
As you can see, the server was struggling now! The red background means that the request took more than 15% longer than the calibration run and the difference from calibration is shown in brackets in the Response Time column. In this particular run, the main HTML took 760ms to deliver which as 411ms longer than the calibration run. We’re also struggling to serve images in a sensible time. This is clearly not ideal!
Looking at what’s going on on the server whilst running a load test is also instructive. A good introduction to the server tools that are useful is 16 Linux server monitoring commands you really need to know by Steven Vaughan-Nichols.
Reviewing results
Once you have a few runs under your belt, the Review page becomes useful. In this page we can see a list of all our previous runs and most importantly, we can edit the title of each run and give it a useful name. It would be nice to be able to store additional notes about each run though.
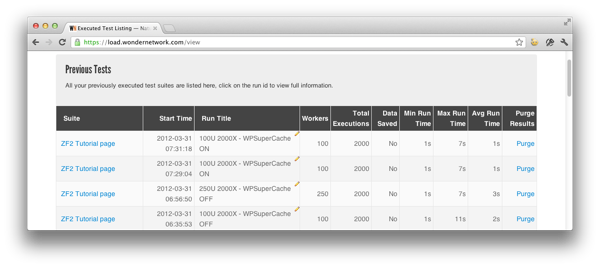
Adding the title makes it much easier to remember why a given run was performed and I’ve found it useful.
Using Natural Load Testing to improve performance
The obvious first target for testing NLT, was my blog at akrabat.com. This is a simple WordPress blog which recently moved to a new server. I haven’t been particularly worried about performance and don’t really expect to ever be slash-dotted (or is it Cal-dotted, nowadays!) any time soon.
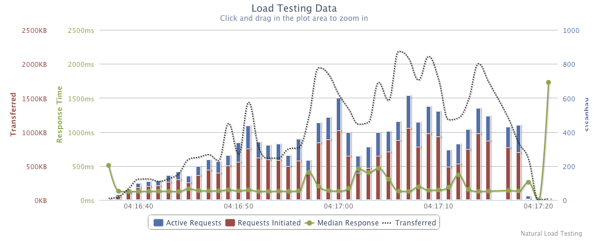
However, as I’ve done nothing to tune the system, this is a good time to see how it behaved. The first run produced these results:
This isn’t good! The only good sign was that none of the 2000 runs actually resulted in an error. A median response time around 1.5 seconds didn’t sound good and the maximum run time was 13 seconds!
Something had to be done!
A little bit of investigating showed that neither APC or WP Super Cache was installed on the server. So I turned them on.
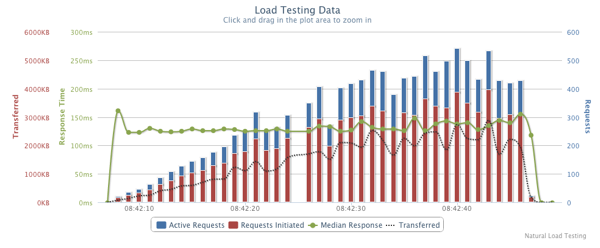
The effect of APC can be seen here:
We now have an average response time of much less than 500ms which seems much saner. There were a number of very long requests of over 1 second though.
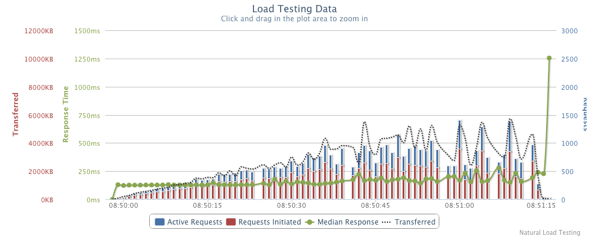
To see if I could improve this further, I then installed and enabled WP Super Cache in PHP mode and re-ran Natural Load Testing. The results were:
Note that you need to be careful when comparing graphs as the axes are automatically scaled. Looking at the results with WP Super Cache was enabled, I can see that the response time display of the graph is much smoother. The tabular data backs this up as it shows that the vast majority of requests were taking less than 200ms with significantly fewer runs taking much longer. Also, the curve of the number of requests initiated vs request active at the end of each second is much smoother, which indicates that with WP Super Cache enabled, the server should be able to hold its own over a longer time period much more easily.
I tested this hypothesis by doing 5000 runs rather than the 2000 shown above. The result was:
Again, the median response time is nicely under 150ms for most of the time, but we have more variance in the response time, with a couple of seconds where the median was significantly over 250ms.
On the whole, my investigations with NLT have made my blog much more responsive and more likely to be able to handle more traffic than before I started this process.
Other thoughts
Having walked though what Natural Load Testing does, I also need to point out that when using it, you can tell that this is a product still in beta! Incidentally, the WonderNetwork people have responded to my reports quickly, even if half the time it was to let me know that my idea or complaint was already on their list!
Nearly all the issues I have with NLT at the moment are related to usability, which I’m sure will be ironed out over time. My “favourite” annoyance as noted above is on the create test suite page where the Save button is above the section where you set up the suite’s steps. If you accidentally press Save after entering a title, then you find you can’t actually add any tests to the steps! There’s also no menu bar or easy way to get from one section to another. You very quickly learn to click on the NLT logo at the top which takes you to the home page.
It would also be good if NLT would allow me to store “execution profiles” so that I don’t have to keep typing in that I want 100 users for 2000 total runs.
I would also like to see more aggregate results. In particular, I’d like to have stats on the response time for say the 50th and 95th percentile. I’d also like to graph these against multiple runs along with the run title so I can see how the site’s performance changed over time. This then leads to the idea that it would be nice if I could schedule a load test once a month at 3am local time!
Conclusion
Natural Load Testing is the first product I’ve used that makes me actually want to do load testing. It makes it easy to run a specific load test and repeat exactly the same test as frequently as you need to. Tweaking the server to see the effect that any given change has becomes an interesting task and your websites can only benefit as you reduce and remove the bottle necks that you find.
On the whole, I’m quite impressed with Natural Load Testing and can see that it could turn into a very useful tool in the web developer’s toolbox.
As I mentioned at the top, NLT is currently in private beta. If you want to get an invite, head over to the sign up form and fill in your details. You also have to read the thank you for signing up message!