Step debugging sphinx-build in PyCharm
I’ve been trying to solve an issue with the rst2pdf Sphinx extension which allows you to use rst2pdf to create a PDF of your Sphinx documentation rather than using Sphinx’s default pdfTeX builder.
In order to understand what was happening, I really wanted to inspect variable at certain stages of the process, which is easiest with a step debugger. As I already use PhpStorm for step debugging PHP, I fired up PyCharm and worked out how to do it there.
Set up a Run/Debug configuration
PyCharm’s debugger works with Run/Debug configurations so that you can set the script to run, parameters, version of Python you want to use, etc. This is accessed via the Run -> Edit Configurations… menu item. It’s also available as a control on the right of the tool bar next to the “play” button.
To create a new configuration, we press the + button in the tool bar of the Run/Debug Configurations window. This gives us a list of possible templates and so I picked Python.
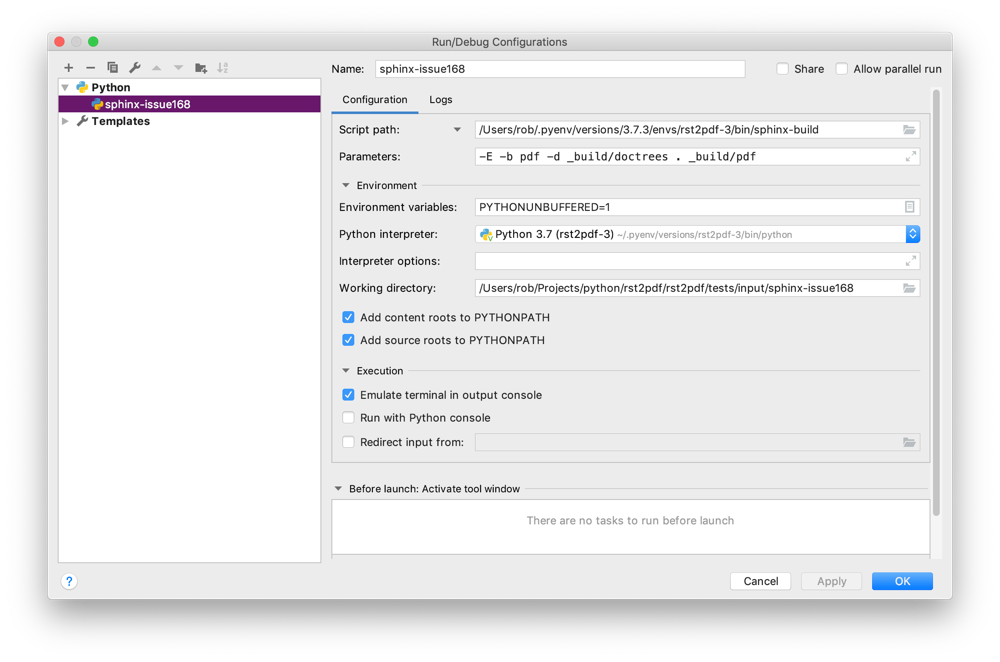
Each configuration needs a name, so I called mine `sphinx-issue168` as that’s test is the one that shows the problem. We can then turn to the key configuration parameters:
- Script path
- This is the python script that PyCharm will run when you start debugging. As I’m debugging a Sphinx extension, I need the full path to sphinx-build which is in the `bin` directory of my virtualenv, so for me this is /Users/rob/.pyenv/versions/3.7.3/envs/rst2pdf-3/bin/sphinx-build.
- Parameters
- The command line parameters to pass to the script. For sphinx-build, I looked up what was passed in the Makefile and used that: -E -b pdf -d _build/doctrees . _build/pdf
The key parameters are -E to force it to rebuild even if nothing’s changed and -b pdf so that it uses the rst2pdf builder.
- Working directory
- This is the directory that the script is run from. Although sphinx-build in on the path, the input files and output directory are relative, so I set this to the directory that the Makefile is in: /Users/rob/Projects/python/rst2pdf/rst2pdf/tests/input/sphinx-issue168 – again, a fully qualified directory as I’m not sure where PyCharm starts from
- Emulate terminal in output console
- Checking this means that we get formatting and colours.
Debugging
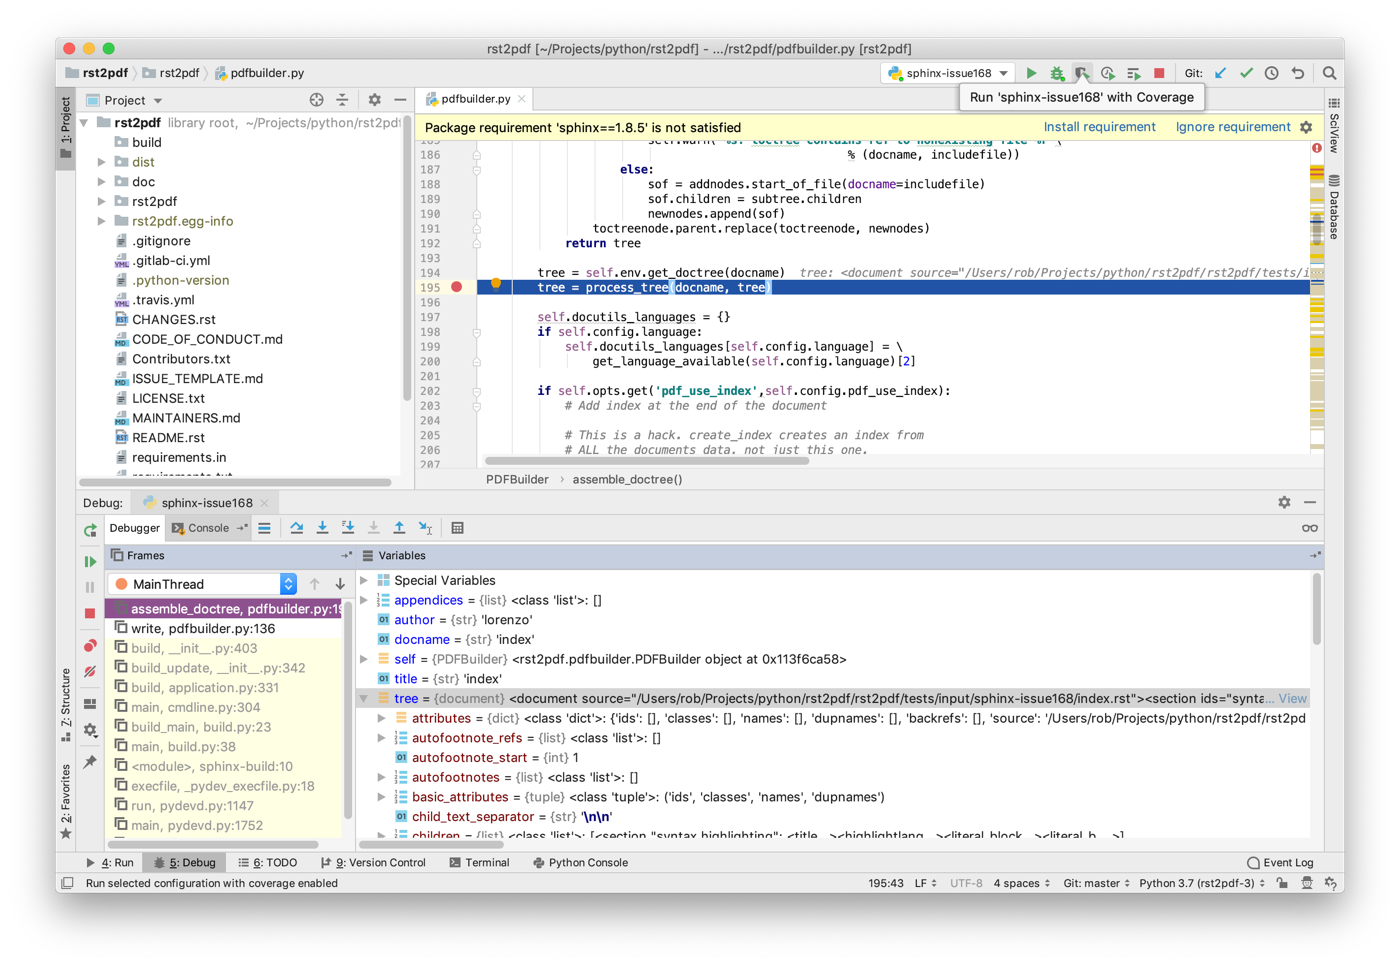
To debug, we first set a breakpoint. On Mac, the keyboard shortcut is cmd+F8.
We can then start the debugger with Ctrl+D (Run -> Debug ‘configuration’ menu item, or press the green “bug” button in the top-right-hand toolbar). PyCharm will open a debug console and you can see you script starting. When the breakpoint is reached, the debug pane changes to Variables view where you can see all the variables currently in scope.
Useful operations from here are:
| Step Over (F8) | Executes the current line and moves to the next one. If the current line is a function call, then it executes the function call behind the scenes. |
| Step Into (F7) | Executes the current line, but if this is a function call, then the debugger will enter the called function and execute the first line of that function call and stop there. |
| Step Out (Shift+F8) | Run until the current function has finished and stop on the next line after where the current function was called. |
| Resume Program (Option+Cmd+R) | Run the script until the next break point or until it completes. |
Once I had this working, I was able to determine how the extension interoperated with Sphinx and work out what had gone wrong. In this particular case, it turned out to be the result of a change in Sphinx that was fixed in a later version that the version I was using.

Hey Rob,
I also had a tricky bug in a sphinx-extension and this blog post saved me a bunch of time. Thank you for writing it – it was really helpful to me!
Best,
Arne
Thanks for writing this Rob. It was an absolute time saver.